
Introduction
randomized controlled experiments are a powerful tool for researchers seeking to establish causal relationships between interventions and outcomes. However, in the context of social science and policy research, experiments can be expensive, impractical, and often ethically questionable to run. Imagine, for example, a country that randomly assigns its regions into treatment and control groups when implementing criminal justice reform, aiming to determine the effectiveness of the change, all else equal. While such an approach might intrigue a few scientists, it would rightly incite outrage among the general population. Up until recently, quantitative social scientists often resorted to running simple OLS regressions on observational data and reported correlations between variables as the estimated effects. This has changed with the introduction of methods that allow researchers identify random assignment of treatment in existing data. Through a bit of creativity, these techniques enable the construction of artificial treatment and control groups without running an actual experiment.
The collective impact of introducing these models has been described as a ‘credibility revolution’ in economics and even led to a shared Nobel prize. Guido Imbens, one of the key contributors to this development, describes a recent addition to the set — the synthetic control method - as “arguably the most important innovation in the policy evaluation literature in the last 15 years” (Athey & Imbens, 2017). In this article, I will offer a practical example of how this method can be applied to a real and current policy case in the energy sector. The article presents a condensed version of an evaluation plan, developed for Sweden’s assessment of its excise tax exemption for high-blended biofuels — an assignment requested by the European Commission. The article also includes an application of the method to real data and preliminary results.
The synthethic control method
The synthetic control method was developed in a series of papers (Abadie & Gardeazabal 2003, and Abadie, Diamond & Hainmueller 2010). It’s now a widely accepted method for policy evaluations in case studies involving a single treated unit. Its first policy application centered on Proposition 99 — an initiative to increase the excise tax on tobacco products in California — by testing its impact on smoking rates.
In the world of politics, conditions conducive to randomized controlled trials are not typically in place. For instance, in the Proposition 99 case, there was no ‘control California’ that remained untreated while also sharing California’s unique characteristics. This lack of a control group presented a challenge in estimating the causal effect of the legislation, all else being equal.
The synthetic control method solves this rather elegantly. It offers an algorithmic approach to constructing control groups. For a treated unit, the control is generated as a weighted average of untreated units that most accurately predicts the treated unit’s outcome variable in the pre-treatment period. Following the treatment, this control group serves as a counterfactual scenario, indicating what could have happened to the treated unit if it had not received treatment.
Applying this to the tobacco legislation case, the synthetic control method calculates the predictors of smoking (such as drinking habits, demographic variables, etc.) from a panel dataset. It uses the predictors to construct a synthetic control from donor states that, having applied weights, match California’s smoking rate in the years leading up to the excise tax change."
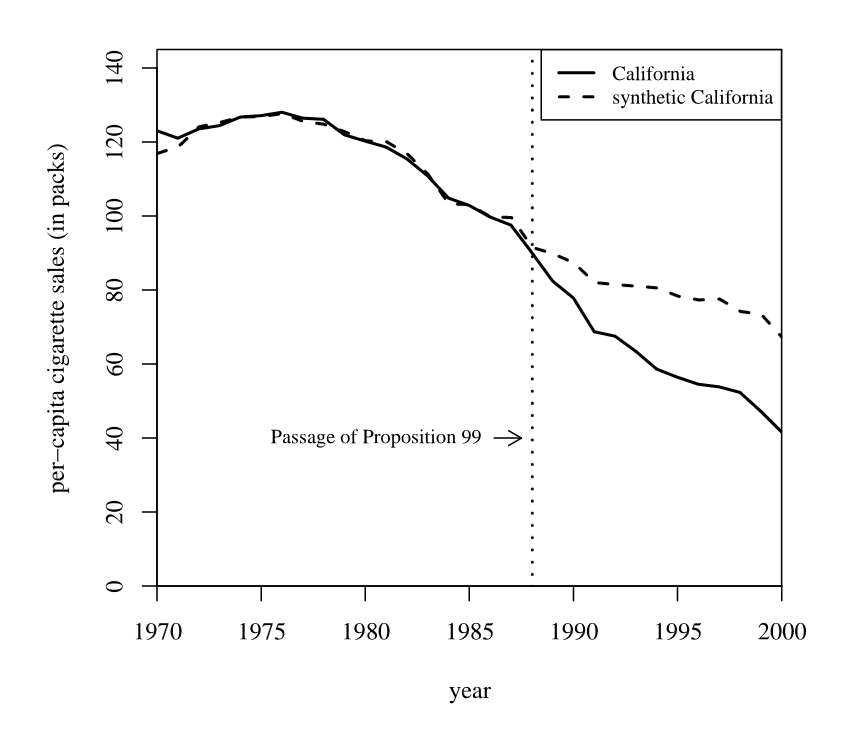
In the post-treatment period, following the policy intervention, the rate of smoking may deviate, reflecting potential effects of the policy. The estimated effect of the excise tax increase on smoking is determined by comparing the actual smoking rate in California to that of the synthetic California during this same period.
The case of Sweden’s excise tax exemption
Sweden introduced an excise tax exemption for high-blended and pure biofuels in two steps, first by removing the energy tax in 2003 and then the carbon tax in 2008. High-blended biofuels include bioethanol based fuels such as E85 and bio/synthetic diesels such as FAME and HVO. The price at pump is often higher for these fuels than their fossil equivalents, even without excise taxes. This limits the impact on fuels used in the passenger fleet, but makes a large enough difference to incentivize transport and public transit companies into switching. Unlike private drivers, they benefit from the utility of of environmental signaling and the ability to meet carbon emission targets. Ultimately, the goal of incentivizing biofuel use is to reduce carbon emissions from the transport sector.
Preparations
So how should we go about constructing the synthetic control? First, we need to know what comparable countries that are untreated, i.e. that had no excise tax exemption in place, during the studied period.
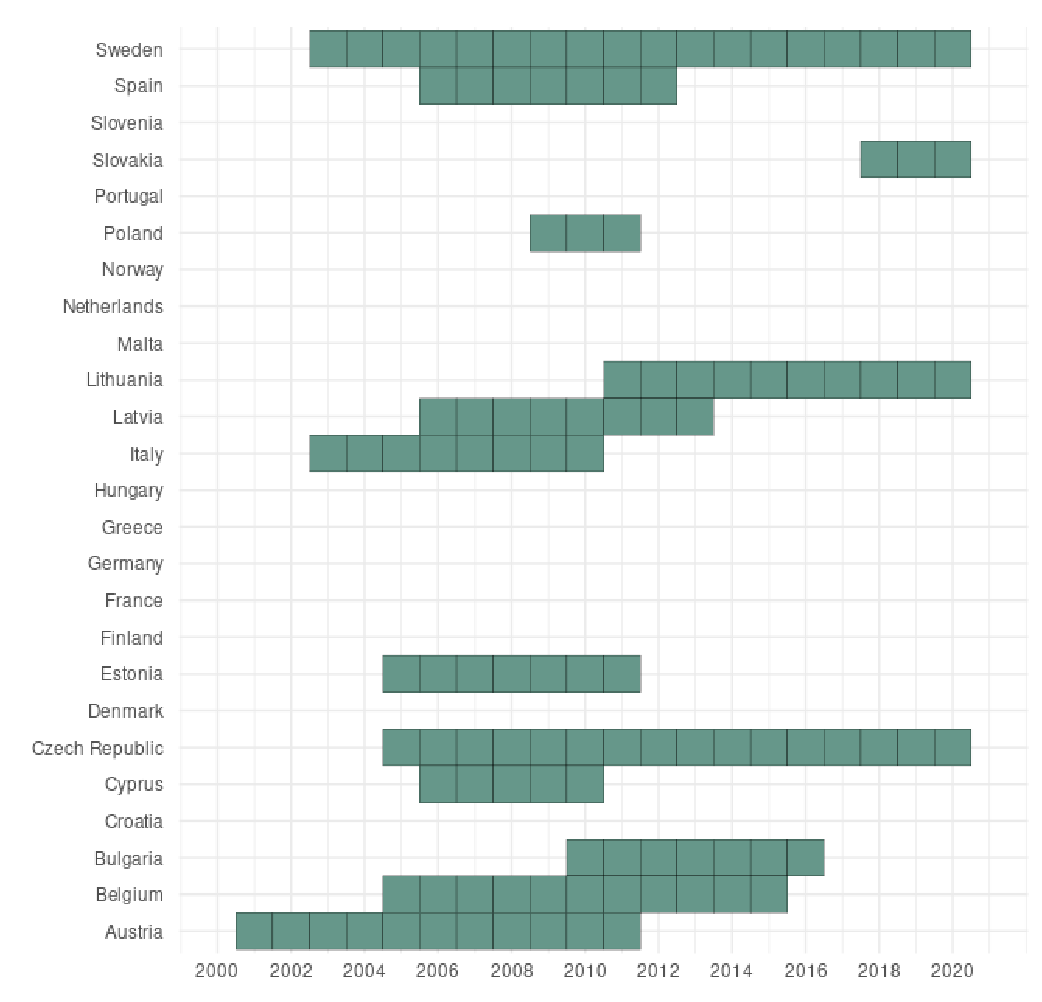
We undertook a binary coding of EU country’s excise tax policies instructed by state aid case documents in the European Commission’s state aid database. This provided us with a set of untreated countries, that can be used as donors for the synthetic control. For the next step, the model needs data on predictors for, in this case, carbon emissions from transport per capita as well as the actual outcome variable.
We were instructed in choosing predictor variables by Andersson (2019) who uses a synthetic control model to estimate the effect of the original introduction of a carbon tax on transport fuels in 1990. The actual data for these predictors was sourced from The World Bank database. For the outcome variable, we gathered panel data covering a broad selection of countries from 1990 to 2019 from the Climate Watch carbon emissions database.
First, let’s compare Sweden’s carbon emissions from transport to those of other countries in our dataset.
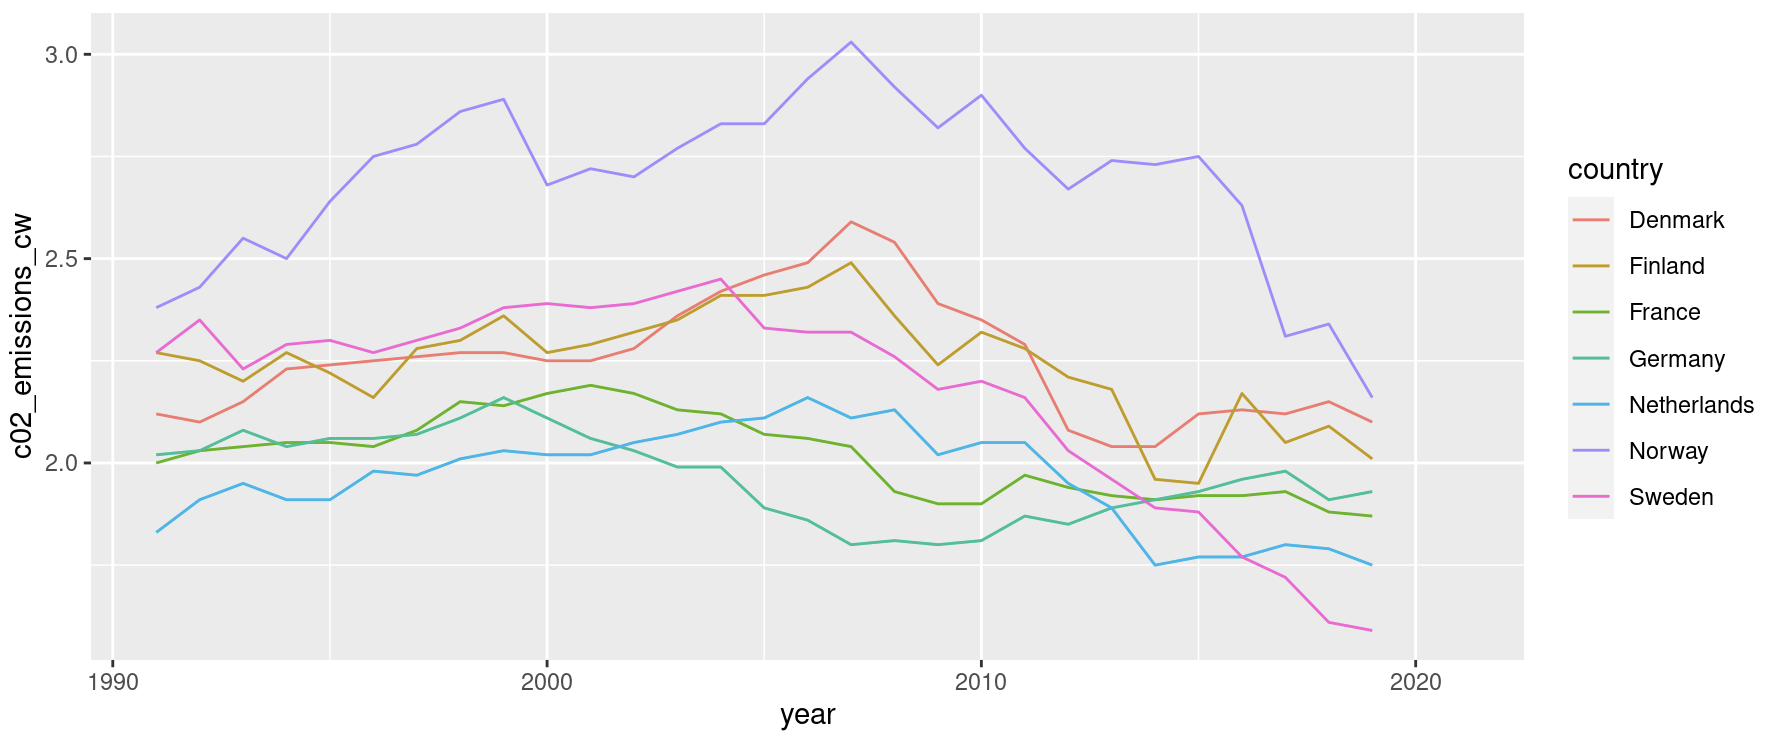
It’s clear that other, but not all, countries in this group experienced falling carbon emissions from transport starting in the late 2000’s. A simple explanation is that all countries adhere to the EU Renewable Energy Directive and similar preceding directives, which dictate biofuel targets for the transport sectors. To reach these biofuel targets, different policy tools were implemented. For instance, some countries introduced obligatory blending quotas for biofuels in gasoline and diesel.
However, the discrepancies in emissions are quite substantial, both in absolute terms and in terms of rate of change. This suggests the presence of confounding factors, which complicate our ability to isolate the effect of a single policy intervention, such as an excise tax change. Moreover, underlying factors such as road networks, GDP, fuel taxes, and more make it difficult to find a suitable control country — one similar to Sweden but without the excise tax change. Simply using the average carbon emissions from transport of all untreated countries as a control would not adequately control for these confounders, making it a poor counterfactual for Sweden.
But what if, instead of an average, we could apply weights to these countries, as determined by outcome and predictor variables, in order to create a synthetic control with a better fit. Having the lines fit, in the pre-treatment period, would indicate that both observed and unobserved confounding variables are controlled for.
Estimating the weights
The synthetic control is constructed by solving an optimization problem, resulting in a set of weights. It’s an optimization problem that seeks to minimize the sum of the absolute differences between the outcome variable for the treated unit (Sweden) and the donor countries.
The first component is a vector of the average of the predictor variables for the treated unit over the pre-intervention periods $T_0$ given by:
$$X_1 = \frac{1}{T_0} \sum_{t=1}^{T_0} x_1(t)$$
The second component is a matrix of the average of the predictor variables for each potential control unit over the pre-intervention periods:
$$X_0 = \frac{1}{T_0} \sum_{t=1}^{T_0} x_{0}(t)$$
And the optimization problem can be defined as:
$$\min_W \quad || X_1 - X_0 W ||$$ $$ \text{subject to } W \geq 0, \quad \sum_{j=1}^{J} W_j = 1$$
Here, W is a vector of weights for the control units that minimizes the difference between the treated unit and the synthetic control unit in the pre-intervention period. Each weight in W corresponds to one control unit (one country in this case). The constraints that W ≥ 0 and Σ W = 1 ensure that the weights are non-negative and sum to 1.
The predictor variable weights are implicitly and recursively determined in this process, so as to minimize the difference between the outcome variable for Sweden and the synthetic control.
Here are the predictor values that I obtained in this test run:
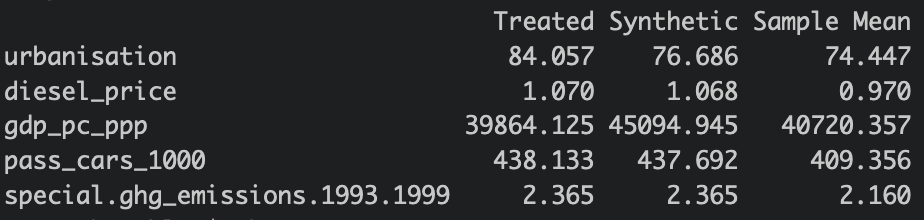
We can see that it optimized for a close match between Sweden (treated) and the synthetic control (untreated) in terms of diesel price, passenger cars per 1000 inhabitants and previous carbon emissions from transport, indicative of that these were strong predictors of the outcome variable.
In terms of country weights, I obtained the following:
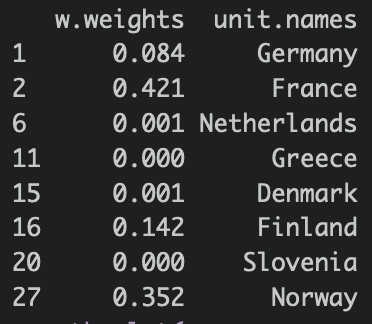
The algorithm determined that France, Finland and Norway were the most suitable donor countries for the synthetic control.
Results
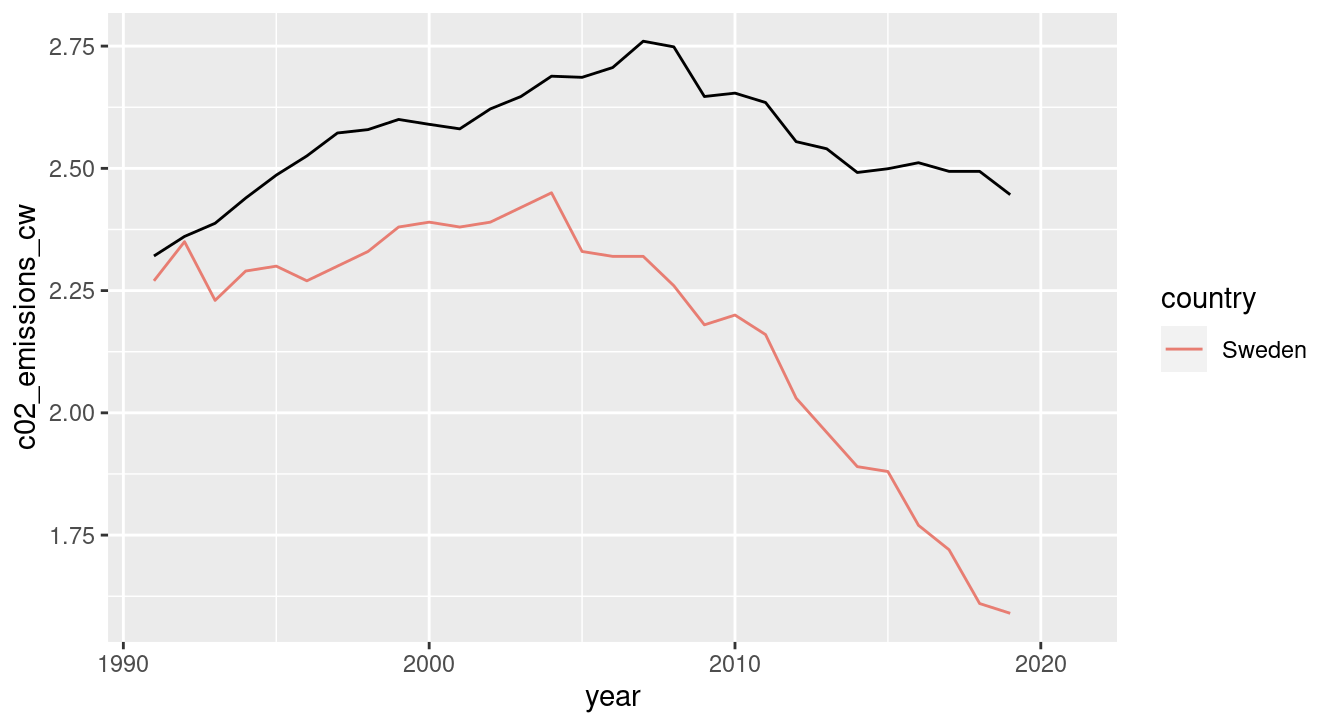
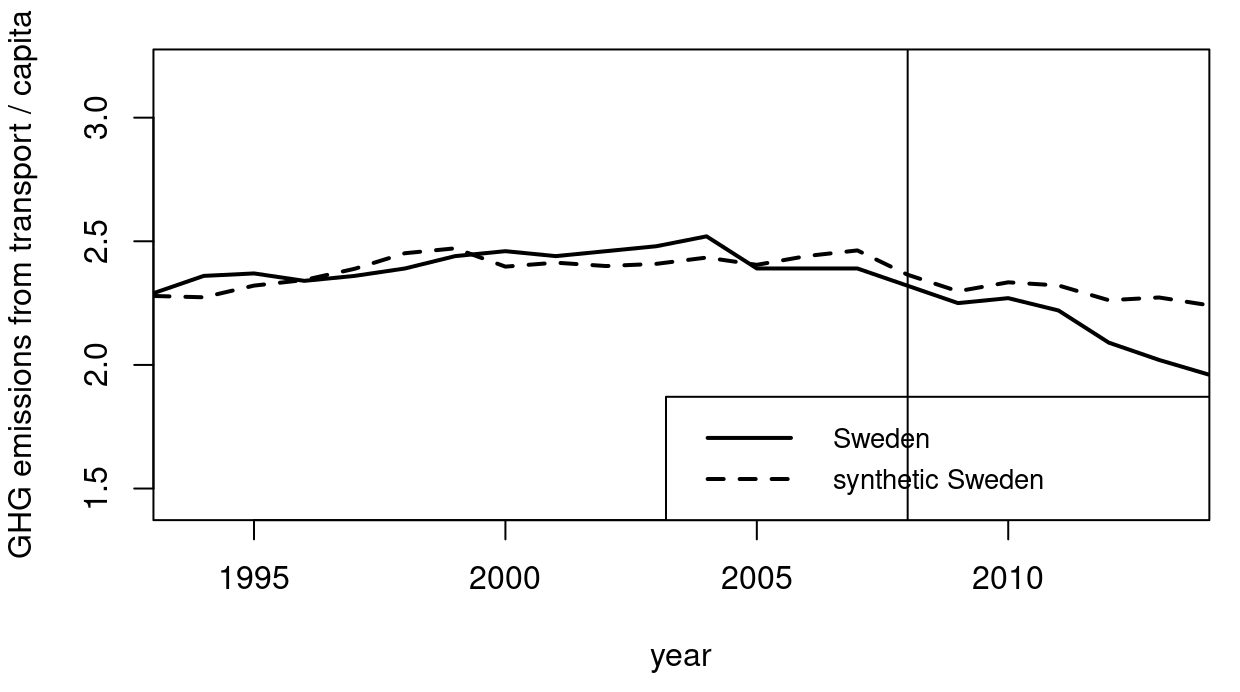
After the synthetic control is constructed, we compare the outcome variable for the treated unit and the untreated synthetic control during the post-intervention period. Any difference between these two could be attributed to the treatment. Granted that the synthetic control has a good fit with the actual outcome for Sweden.
In terms of fit, we went from the average of all countries to the weighted synthetic control:
Discussion
We can see that the synthetic control provides a decent but not perfect fit in the pre-treatment periods. While imperfect, it does a better job than the average at controlling for parts of the variation that stems from covariates such as GDP, diesel price, and passenger car density, as well as unobserved variables. In the post-treatment period, we observe a gradual divergence between the actual carbon emissions for Sweden and the synthetic control which provides us with a counterfactual scenario for the development of carbon emissions from transport had Sweden not implemented an excise tax policy change.
This post offers a basic implementation of a synthetic control model applied to a real and timely policy case. Despite its imperfect execution, the post aims to demonstrate the model’s potential and its relevance for future policy research.
Note: this implementation was done in R, primarily with the Synth library.
References
Abadie A, Diamond A, and Hainmueller J. 2010. Synthetic Control Methods for Comparative Case Studies: Estimating the Effect of California’s Tobacco Control Program. Journal of the American Statistical Association, 105 (490): 493.
Abadie A, and Gardeazabal J. 2003. The Economic Costs of Conflict: A Case Study of the Basque Country. American Economic Review, 93 (1):113–32.
Andersson, J. 2019. Carbon Taxes and CO2 Emissions: Sweden as a Case Study. American Economic Journal: Economic Policy, 11 (4): 1-30.
Athey, S, and Guido, I. 2017. The State of Applied Econometrics: Causality and Policy Evaluation. Journal of Economic Perspectives, 31 (2): 3-32.