While initially hesitant, owing to a sense that I would rather be involved in actual research, visualizing data turned out to be a creative outlet in the midst of more heavy data wrangling and theoretical work.
All visualizations were made in R with ggplot2.
Climate adaption
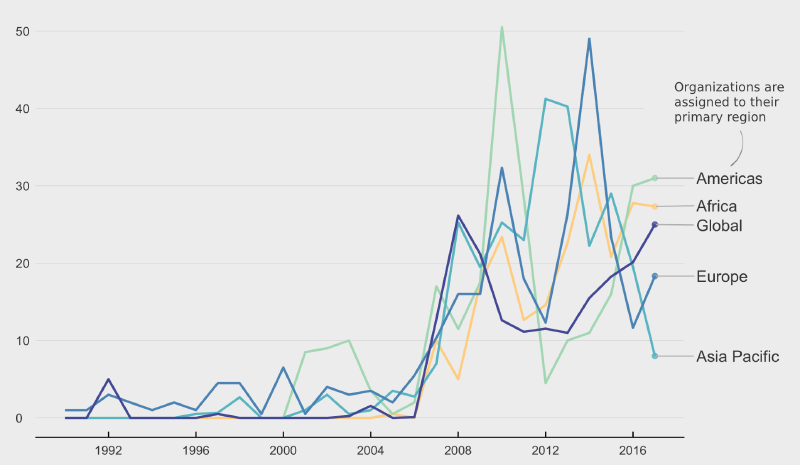
The first set of visualizations were made from a large panel dataset on the climate adaption activities of international organizations, developed for a PHD thesis by Ece Kural. A lesson I drew from this was to include less text in the subtitle.
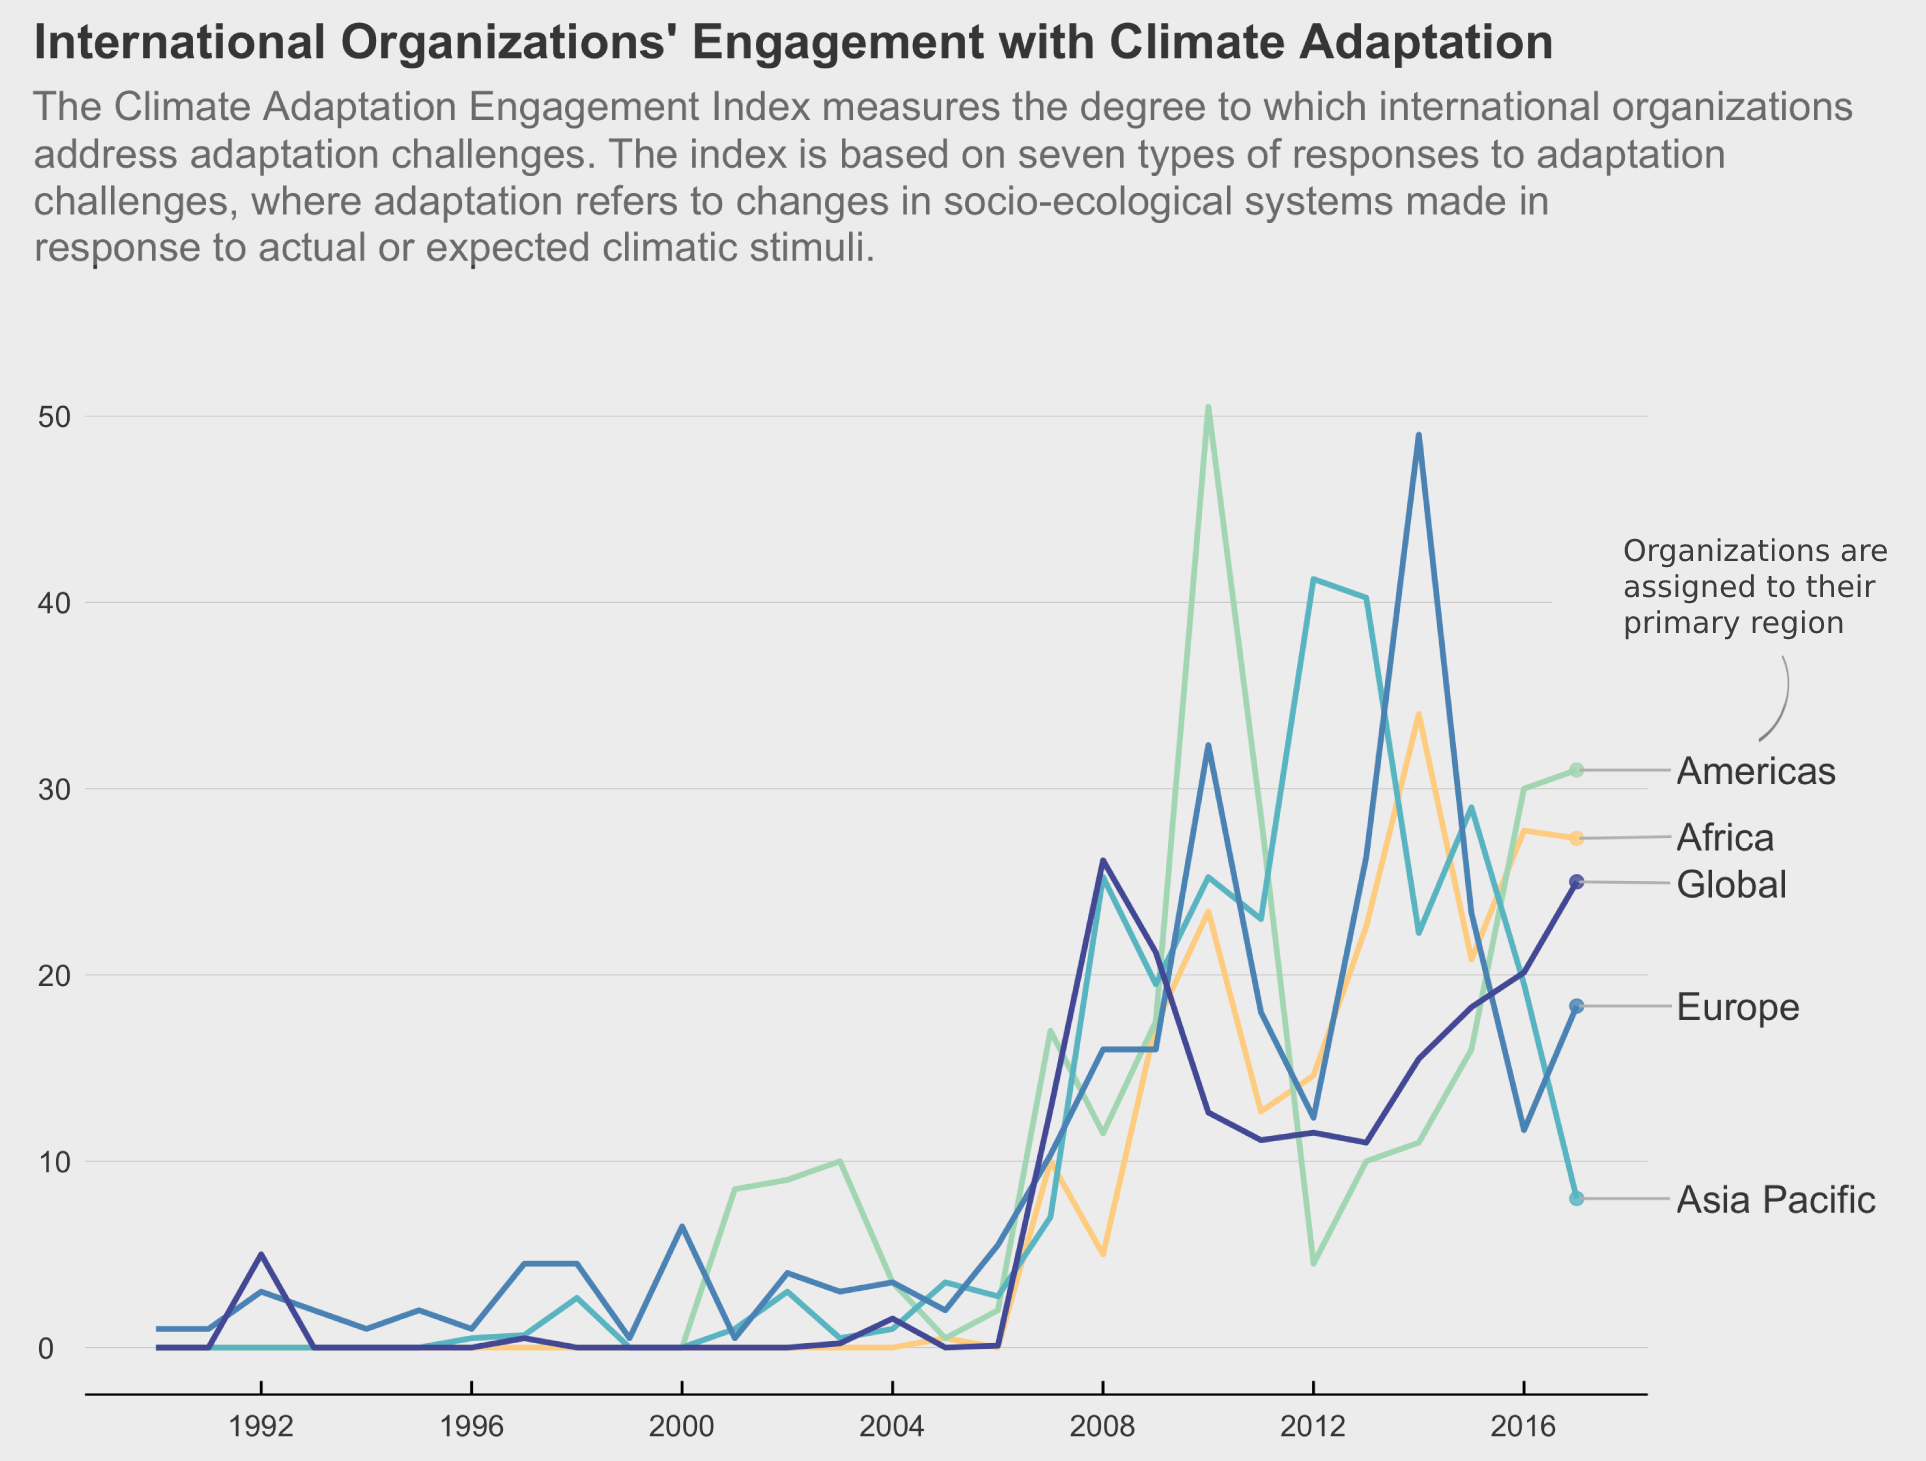
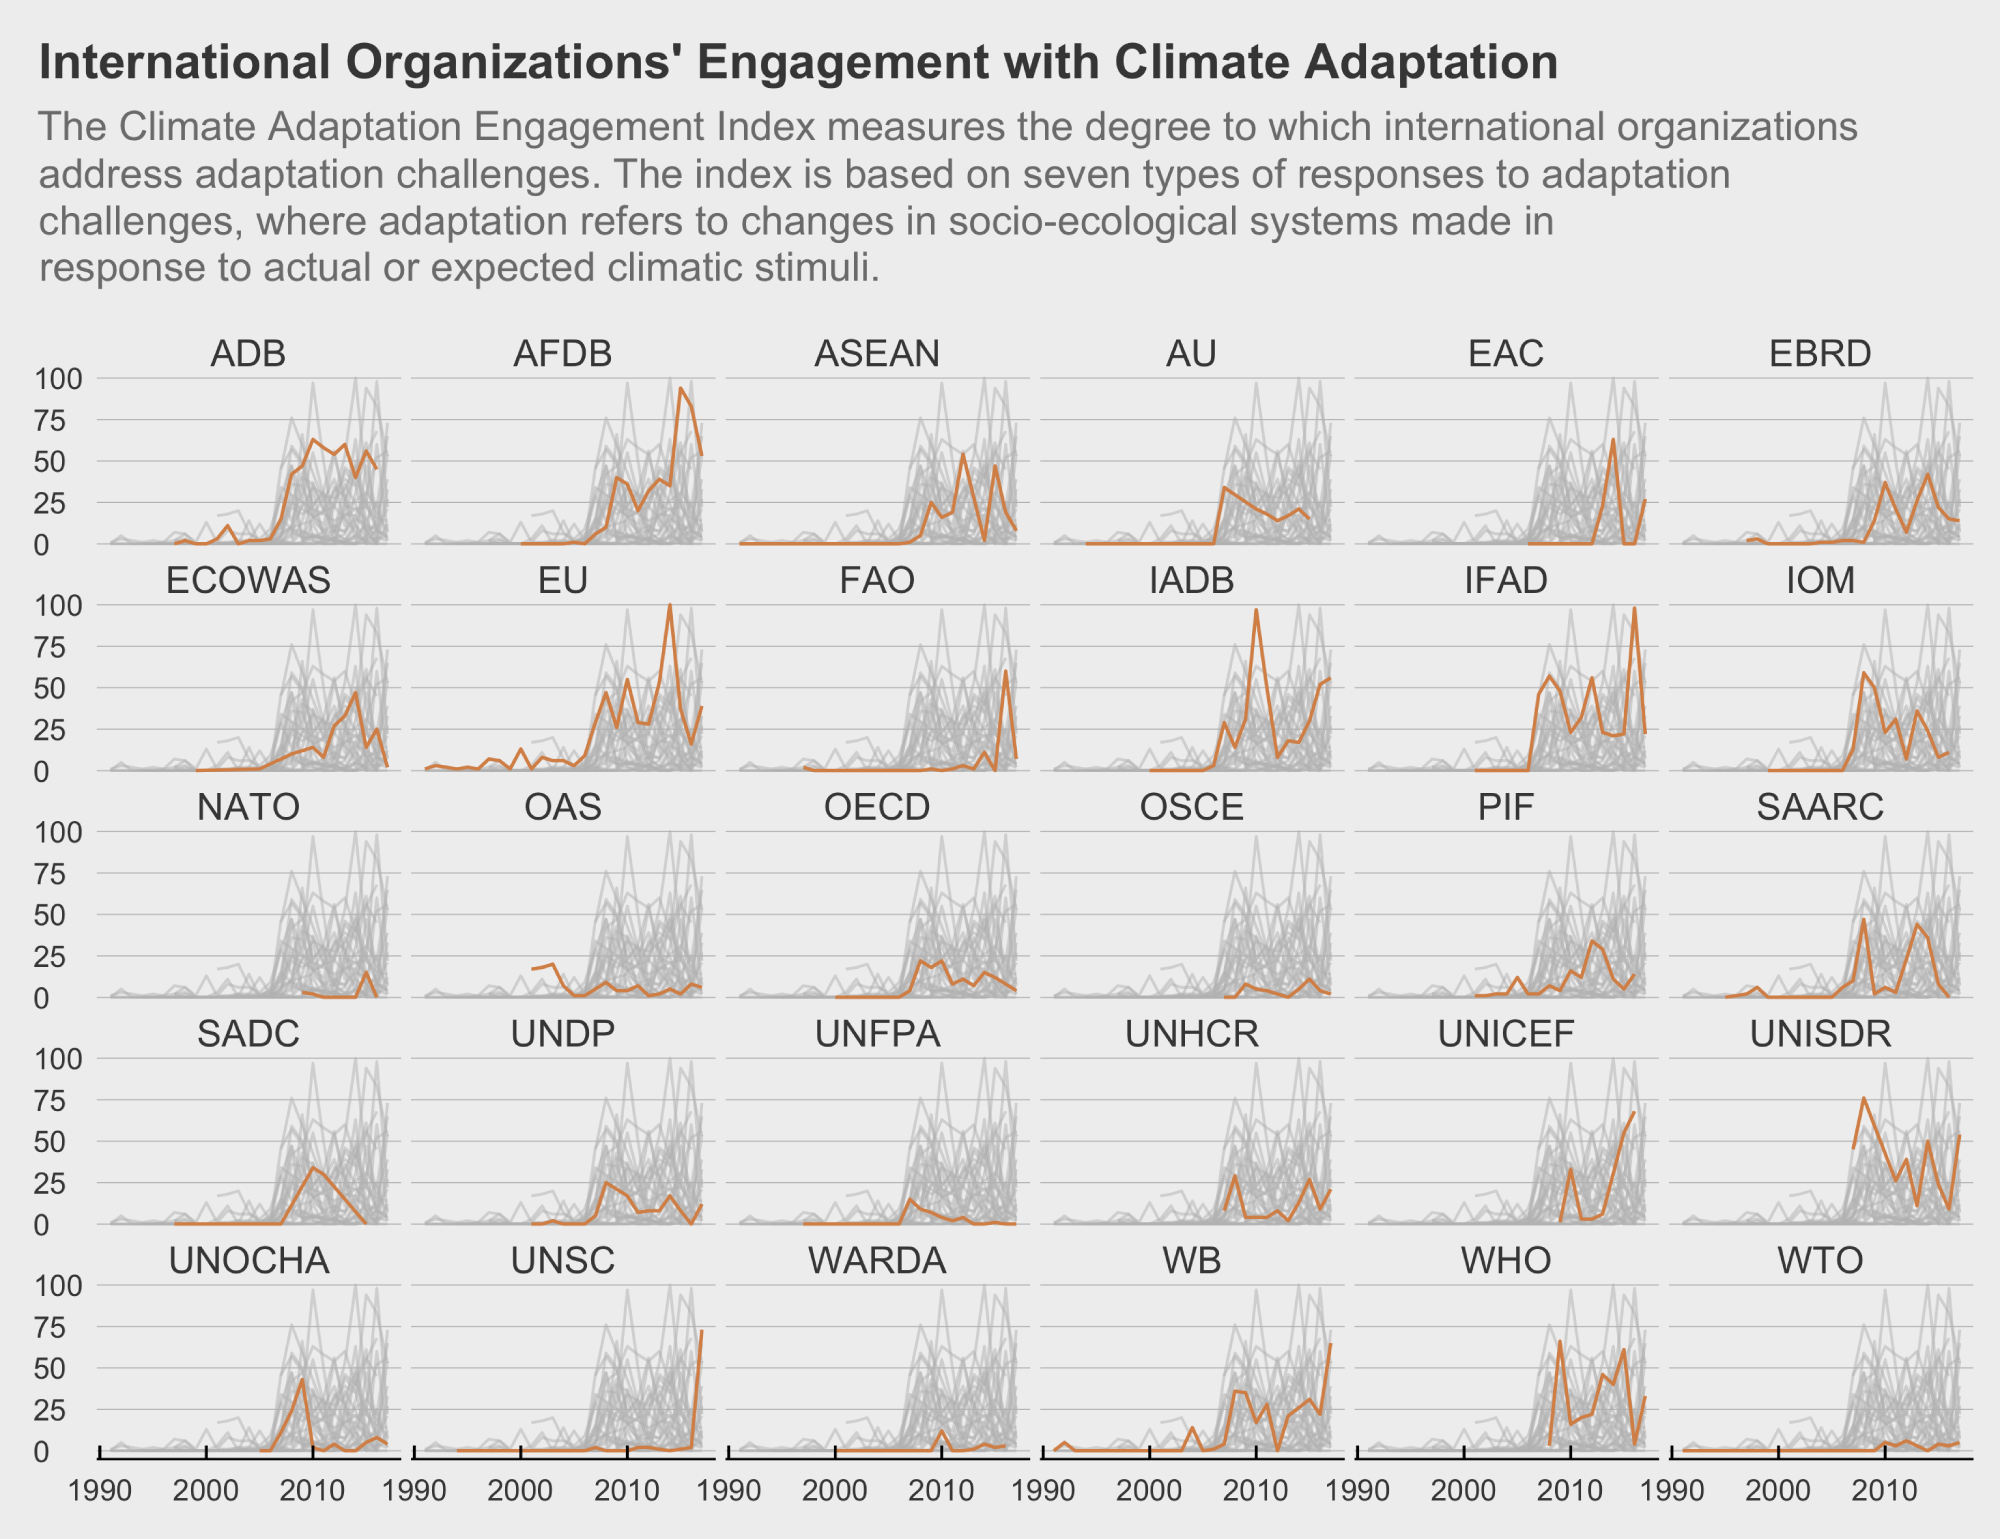
This simple line graph of aggregated values by region was complemented by a facet of all organizations, maintaining some overview and comparability while displaying a lot of data in one visualization.
Finally I tapped into the animated graph craze with a gif. I didn’t manage to iron out all the kinks before time was better invested in other projects.
Legitimacy gap
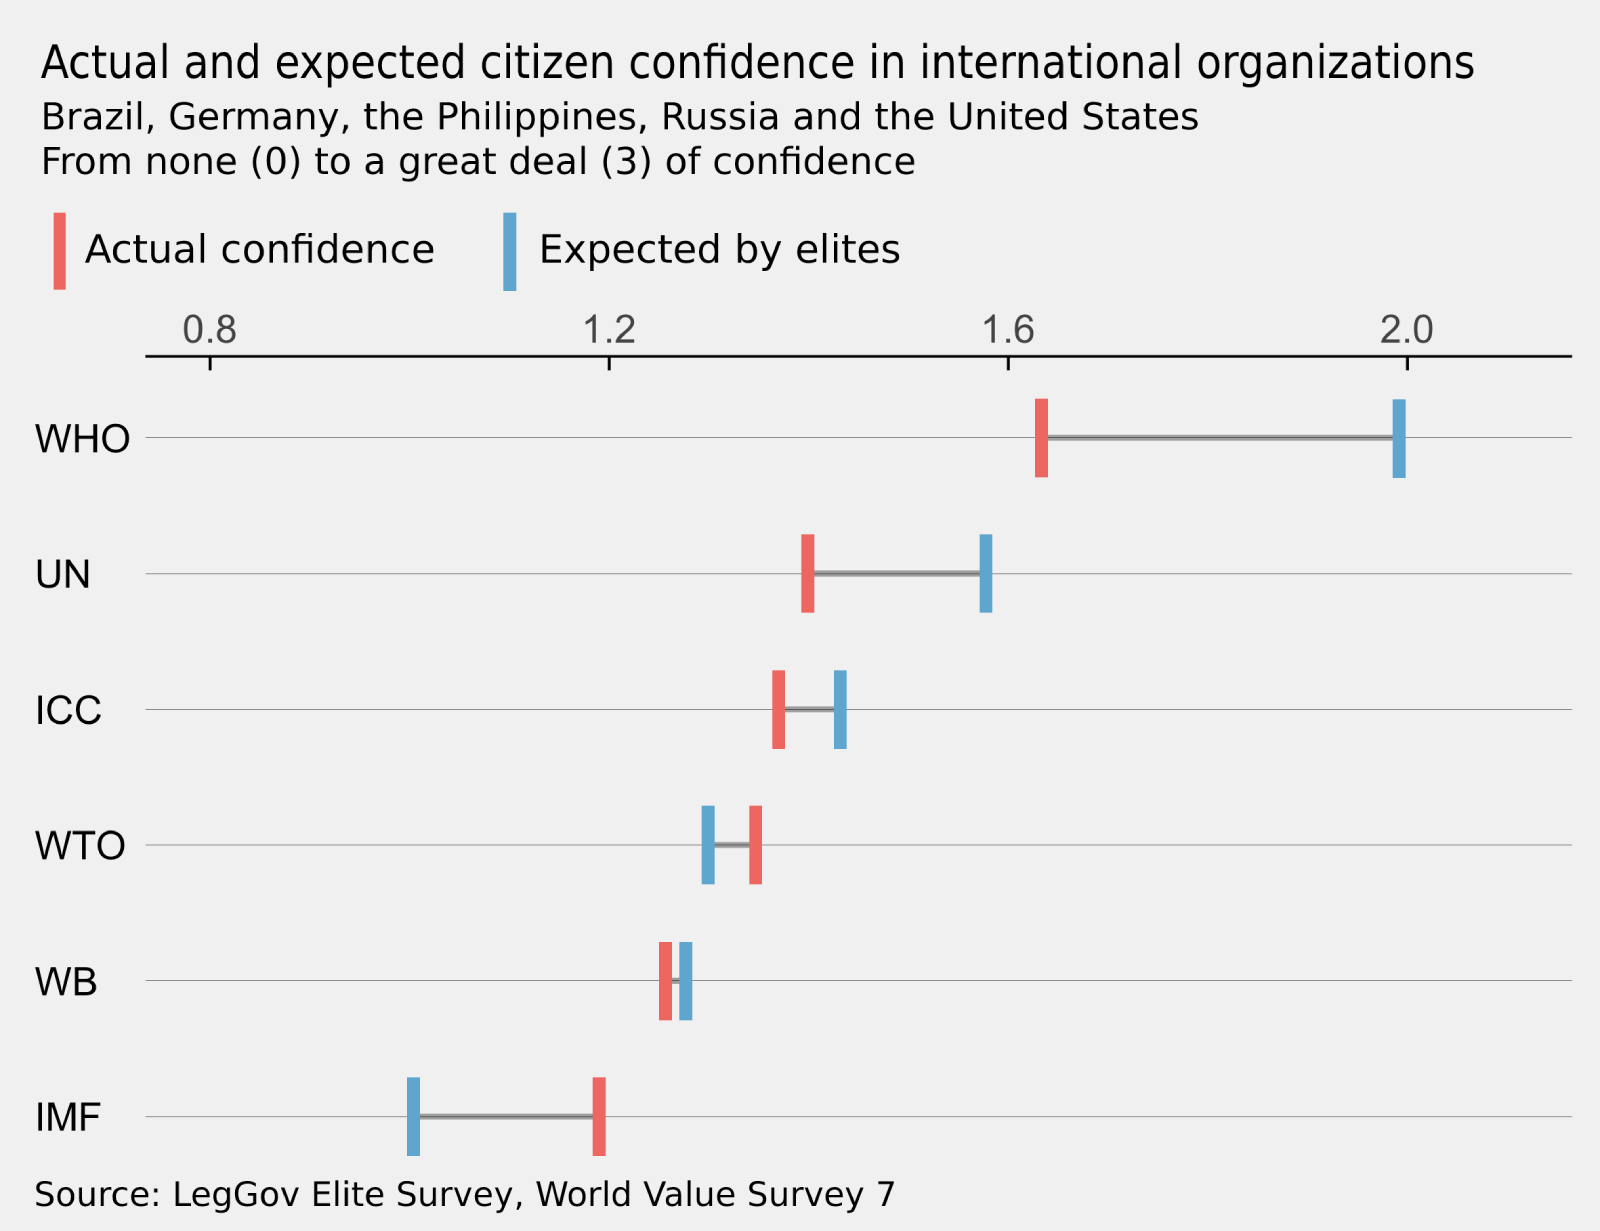
I was asked to coauthor a background paper with Assoc. Prof. Lisa Dellmuth on the gap in legitimacy beliefs (trust) between citizens and elites towards international organizations. The main research was already done but in order to tailor the paper for the UN Stockholm50+ conference, I got to work with the underlying data in order to analyze it along cross sections that were more relevant to this context.
Along the way I made a few simple visualizations thematically close to those commonly found in The Economist. By this point I pivoted towards the style and formatting used in business news outlets for increased clarity and readability.
Other
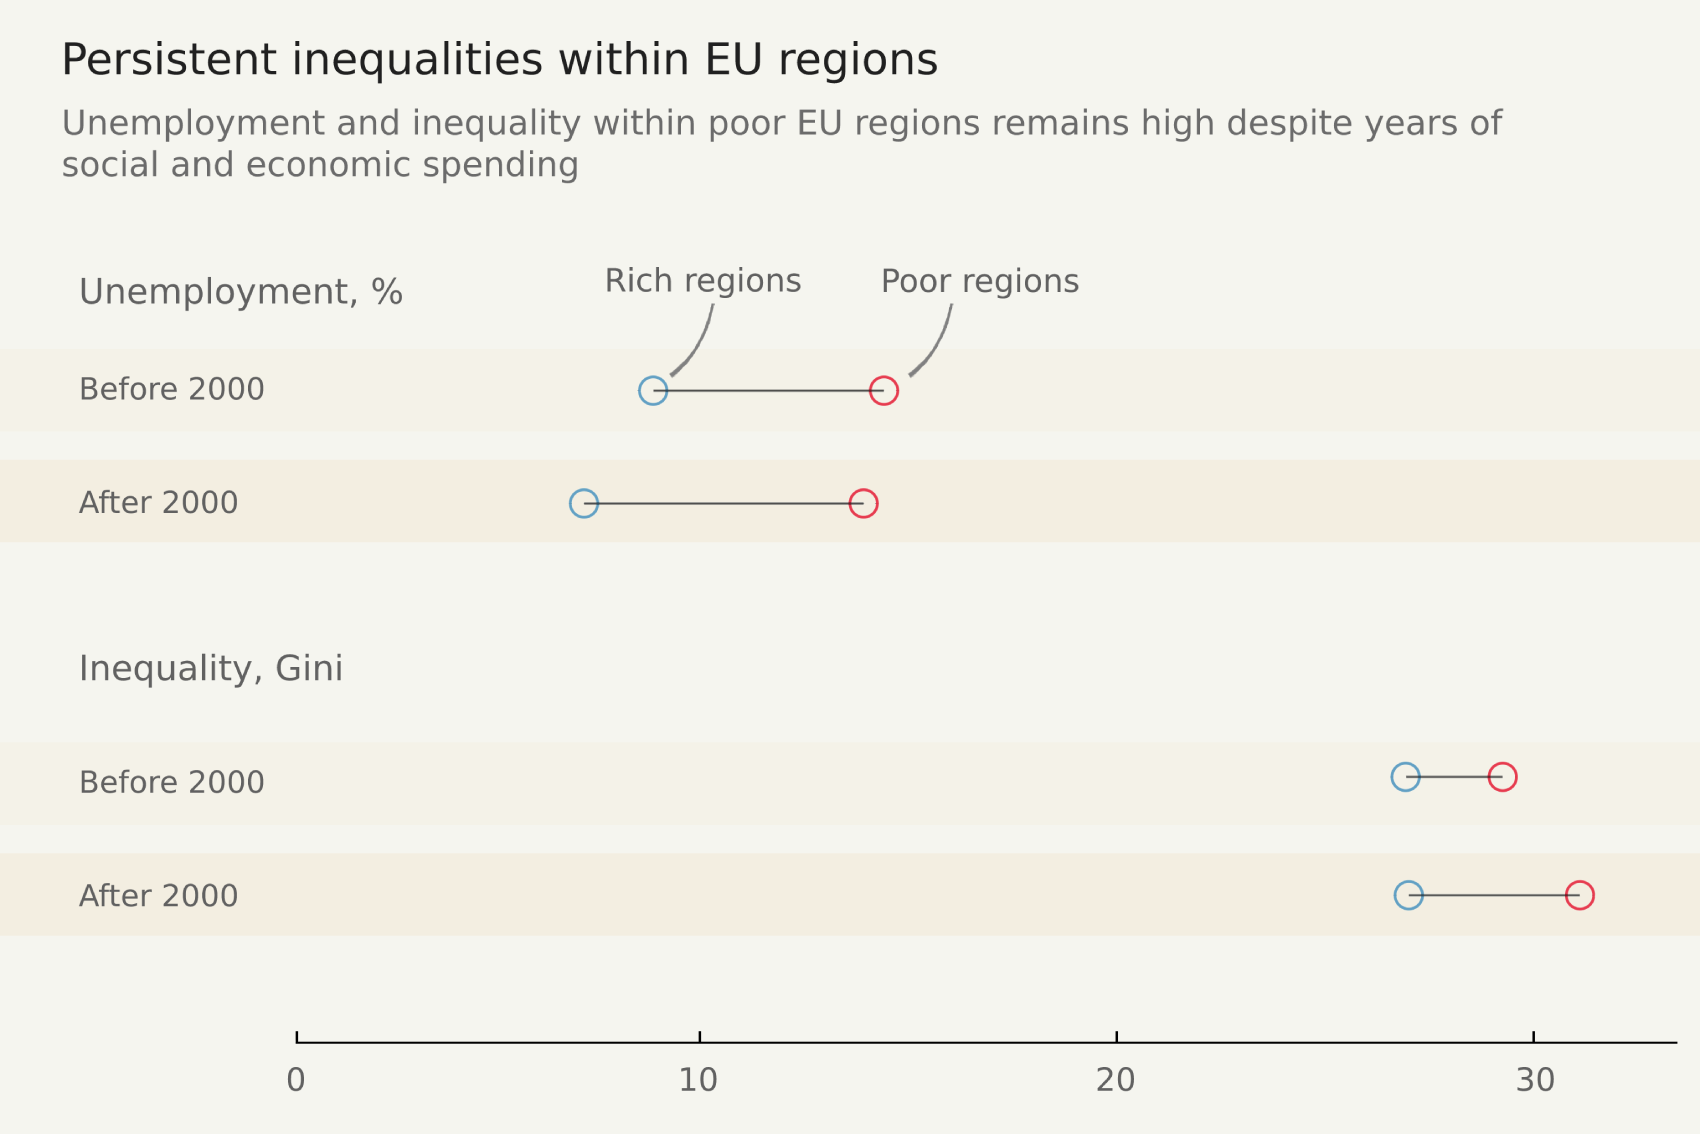
It’s challenging to communicate findings for multiple variables from panel data along a uniform y or x-scale. Here I used a dot plot and averaged the values with the year 2000 as a divider. This was for book project by Lisa Dellmuth on inequalities within EU regions.