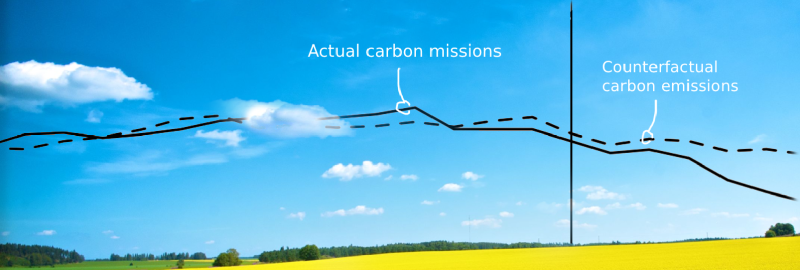
The European Commission has requested Sweden to evaluate the effects of its excise tax exemption for high-blended biofuels. In response, we submitted an evaluation plan, a condensed version of which I will present here, where I also test it empirically using a counterfactual method with observational data.
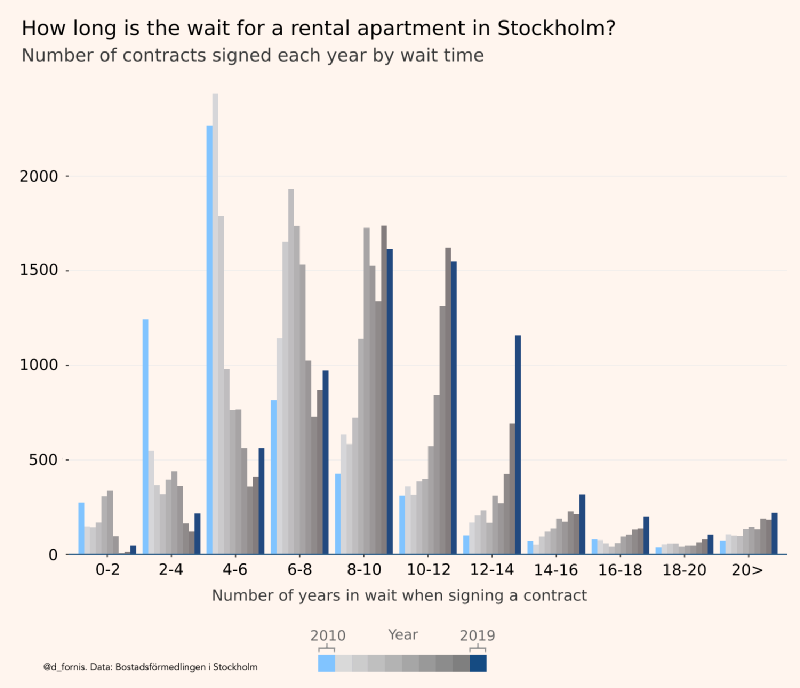
20,000 politically interested swedes clicked on my rather dry-looking plot. It tells the story of a rapidly deteriorating market for rental apartments.
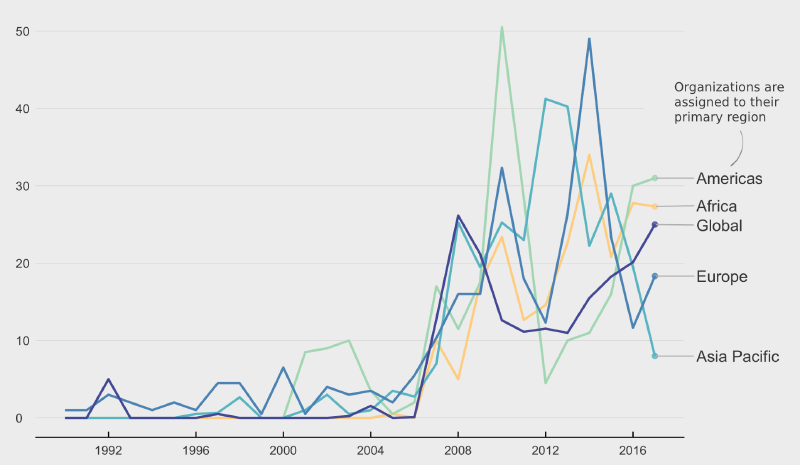
In 2021 I joined the research project GlocalClim as a research assistant. One of my tasks was to explore and visualize some of the datasets that were being generated for papers and theses within the scope of this project.
The standard tool set for making economic forecasts has had trouble keeping up with the sudden change in human behavior caused by the Covid-19 pandemic. In this experiment I explore if Google Trends data can be used to predict movement patterns week by week in times of high uncertainty. This prediction can in turn be used as a high frequency leading economic indicator.